 In this post we will wrap up part 6 by looking at some DC performance tests (apologies in advance for the fact that these tests are not very photogenic). And I’ll also dig a little deeper in the mystery of the serial port errors from last time.
DC Performance Tests
For this test, the idea is to increase the trace resistance of the Vdd trace to the MCU until it quits working. Automating these tests is possible, but there are some issues. The main one is how to tell that the MCU has quit. We could run a serial link test and look for that to timeout. Generating a train of pulses and looking for them to quit, kind of like an external watchdog timer, would also work. One complication, regardless of how you detect it, is that once the MCU has died because of low voltage, it’s in a weird, undetermined state. During preliminary manual tests, sometimes it needed a hard reset to recover. And several times the USB connection with the test computer was broken (sometimes the TraceR lost connection, too, for reasons that aren’t clear). This causes havoc on a test program, because the USB ports for each device might swap around in the middle of the test.
Therefore, since these tests don’t require a lot of measurement points or repetition, I decided to perform them by hand. I wrote a short program to display a running clock on the OLED screen, and used that as my indicator of MCU death. With each increase in the resistance setting, I can see at a glance whether the clock stops counting.
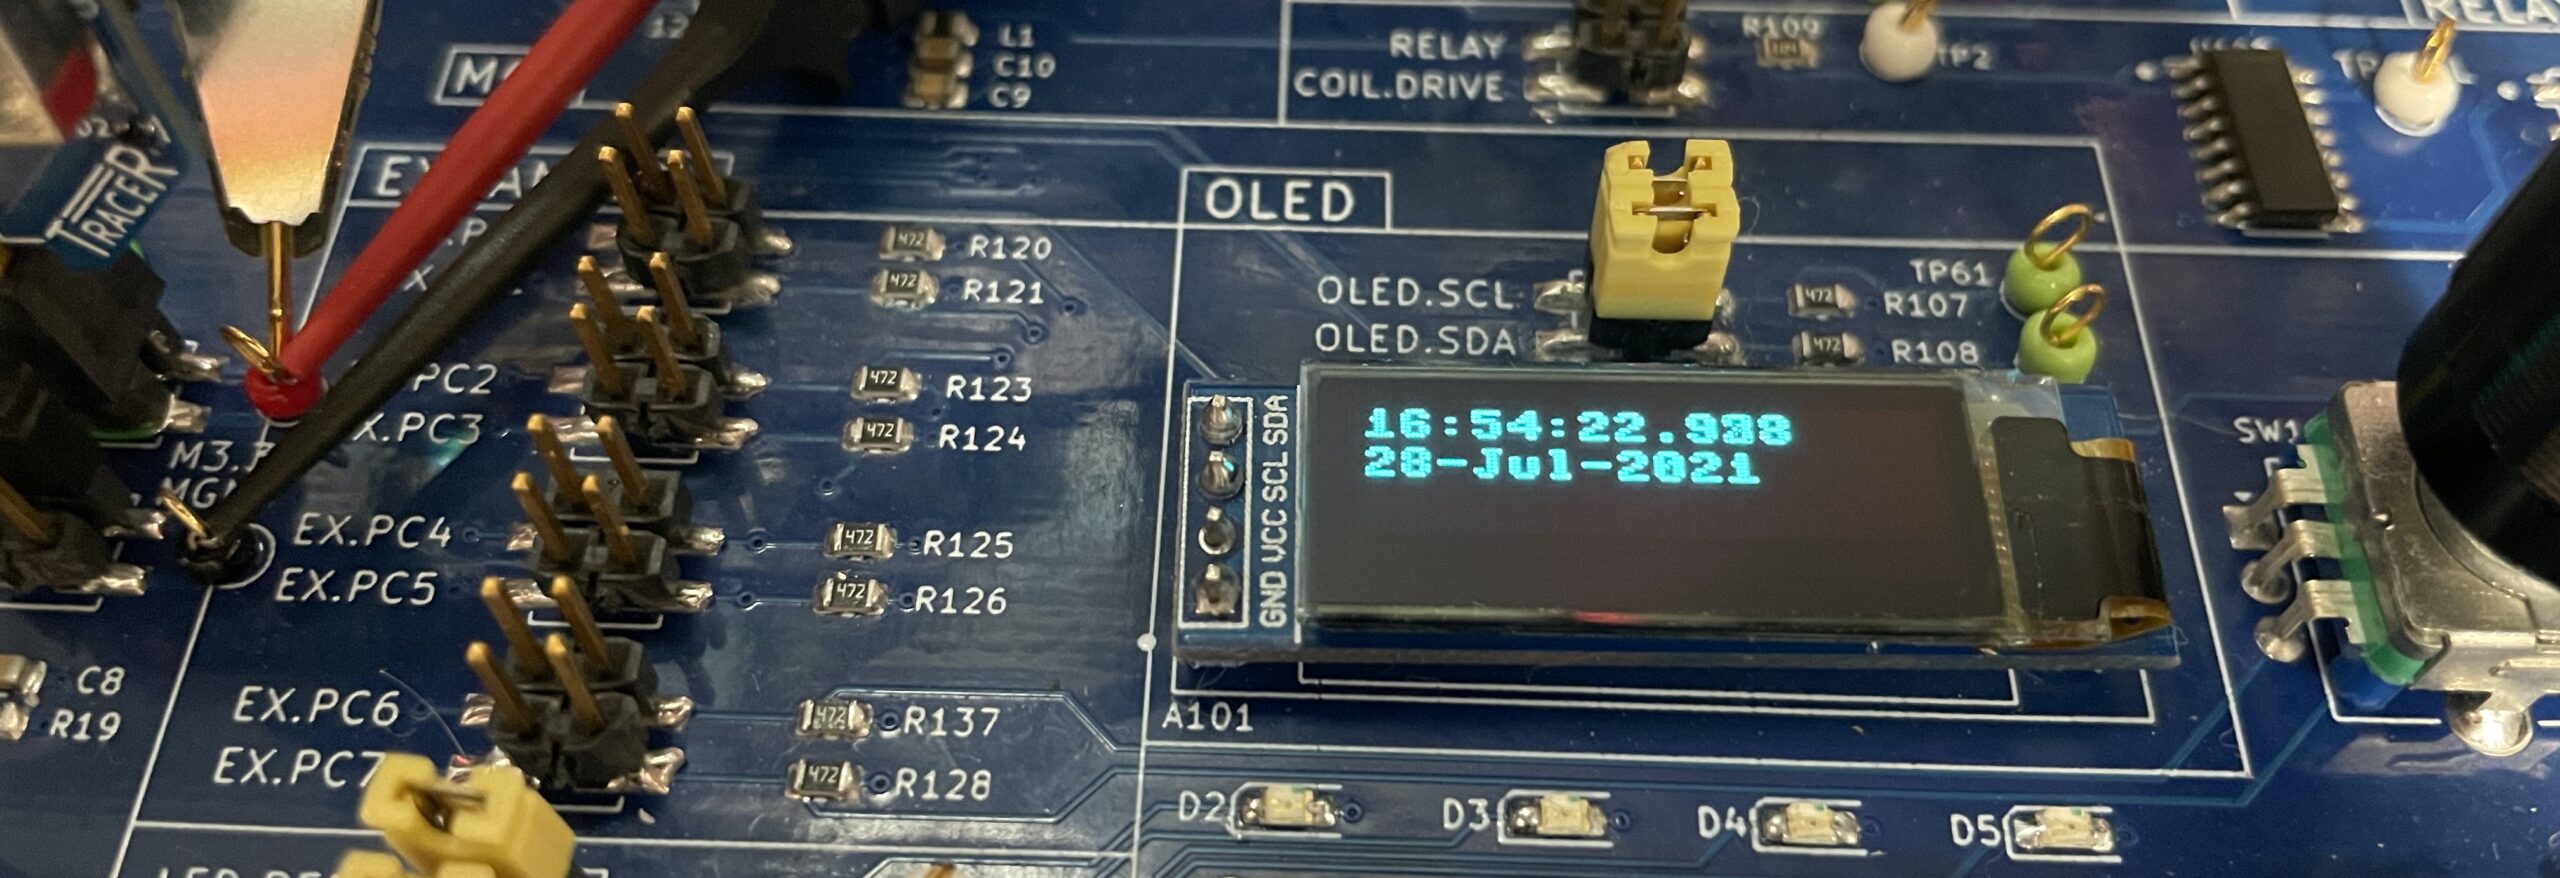
The below code snippet shows the guts of program — a forever loop which gets the time of day and displays in on the OLED.
Clock Program Code Snippet:
def get_the_time(): t = utime.localtime() ms = utime.ticks_ms() % 1000 strtime = '{:02d}:{:02d}:{:02d}.{:03d}'.format(t[3], t[4],t[5], ms) strdate = '{:02d}-{}-{:4d}'.format(t[2], MONTHS[t[1]-1], t[0] ) return strtime, strdate while(True): #utime.sleep_ms(1000) hms, mdy = get_the_time() oled.display_time(hms, mdy)What is the Load?
For purely theoretical purposes, a running microprocessor is not the most logical approach — the load presented by an MCU is dynamic. It depends on what programs are running, the clock speed, whether or not any power-saving measures have been implemented by the program, etc. In fact, there are so many permutations that I couldn’t even cover the majority of cases with a reasonable number of tests. Instead, I just picked one condition for testing. But I chose one that is common and could easily be replicate as a starting point by others.
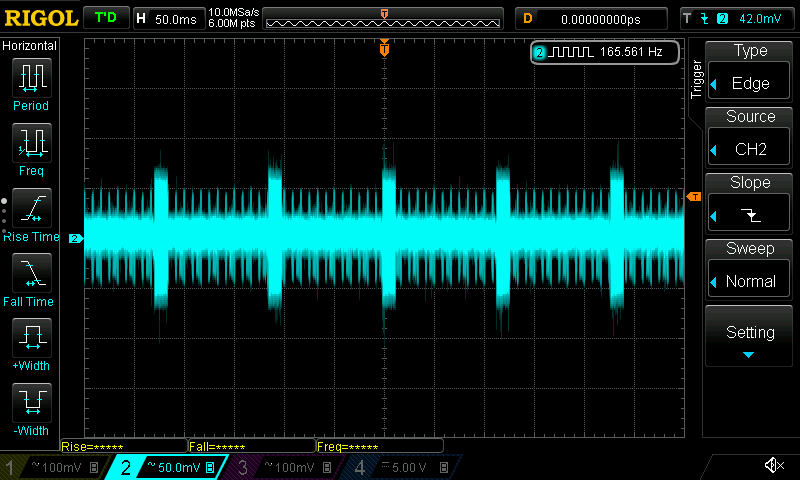
Just plugging in the Tarte-Py with no program running and Micropython idle, the current draw is about 25 mA. When running the clock program, adjusting the sleep time in the first line of the loop changes the average current that the MCU draws from the power supply. Eyeballing it on the ammeter, it jumps between the 25 mA idle current and about 40 mA (see the figure below, it’s noisy but shows the concept). With the sleep eliminated as shown above, that is, running the loop as fast as possible, it draws about 60 mA. I decided to use this full-speed mode for the tests.
DC Test Results
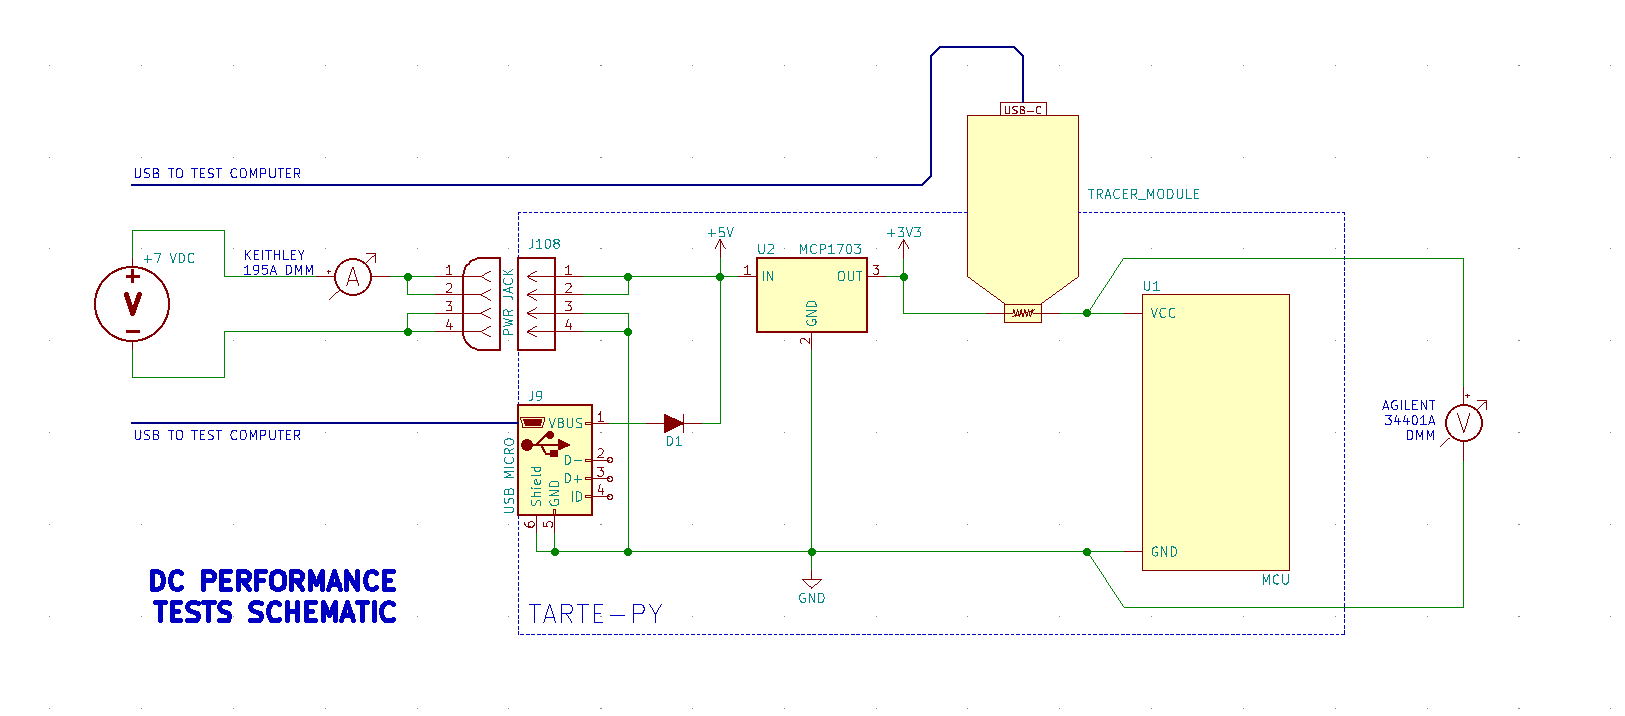
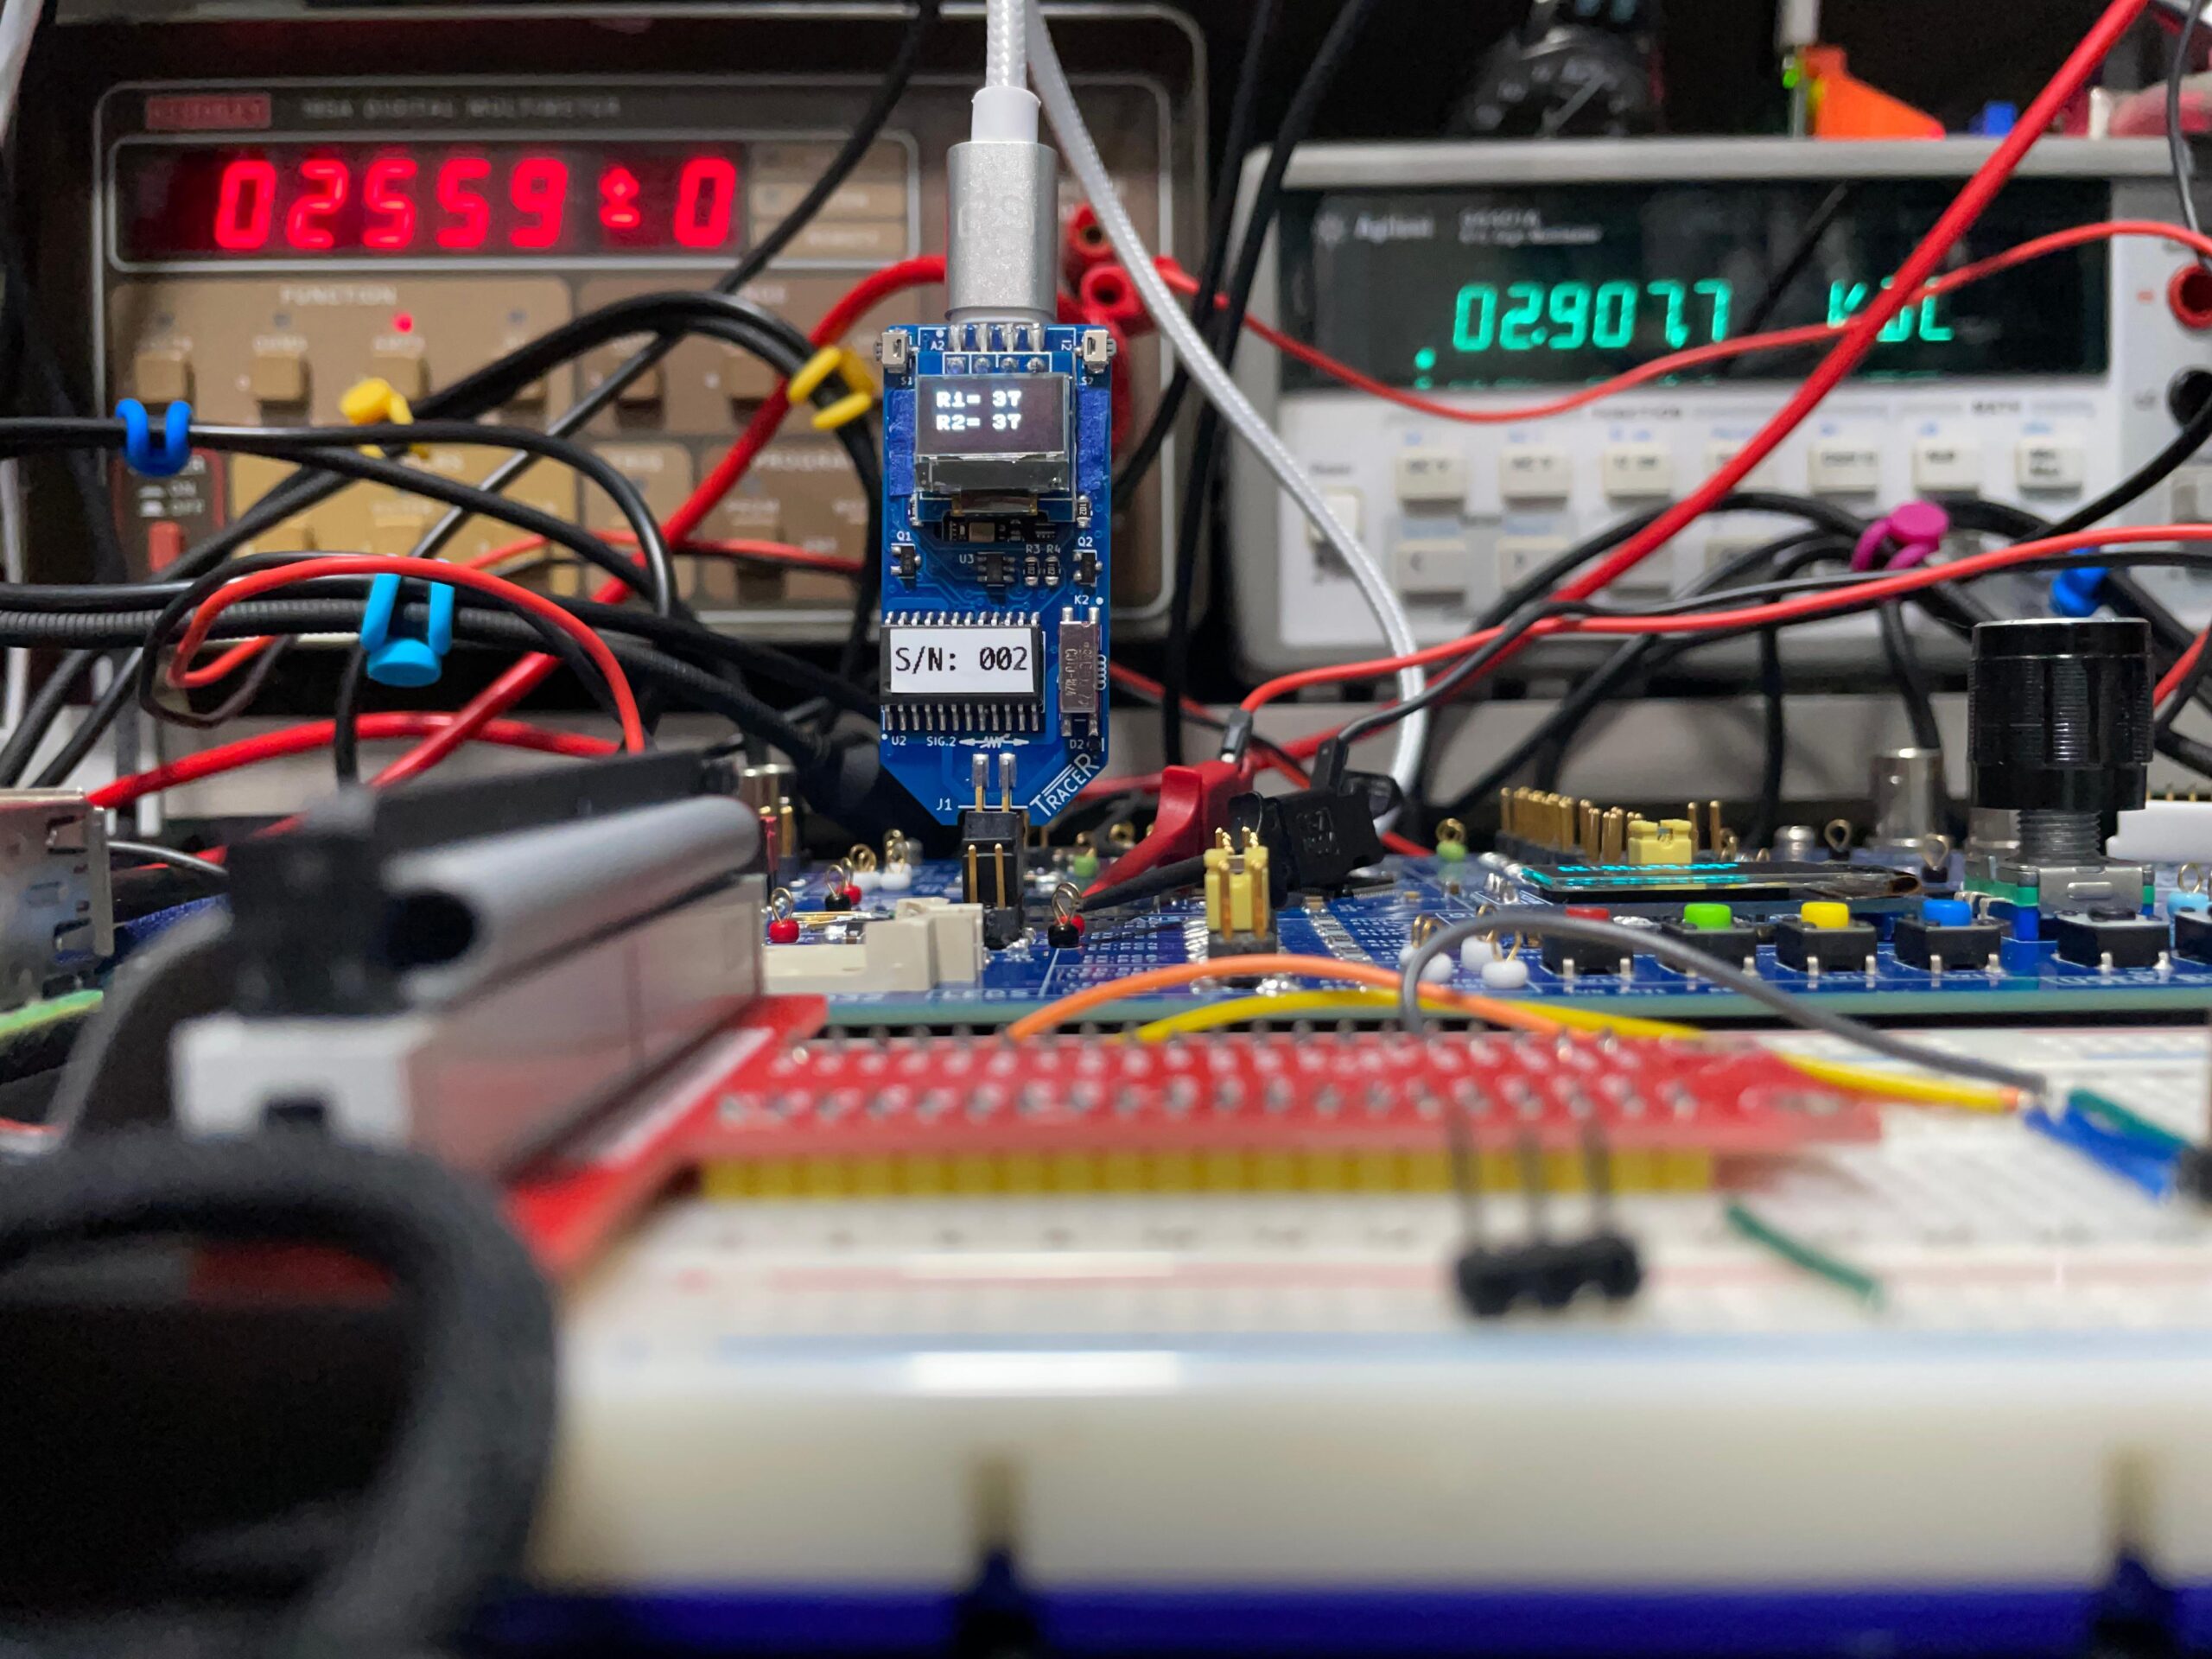
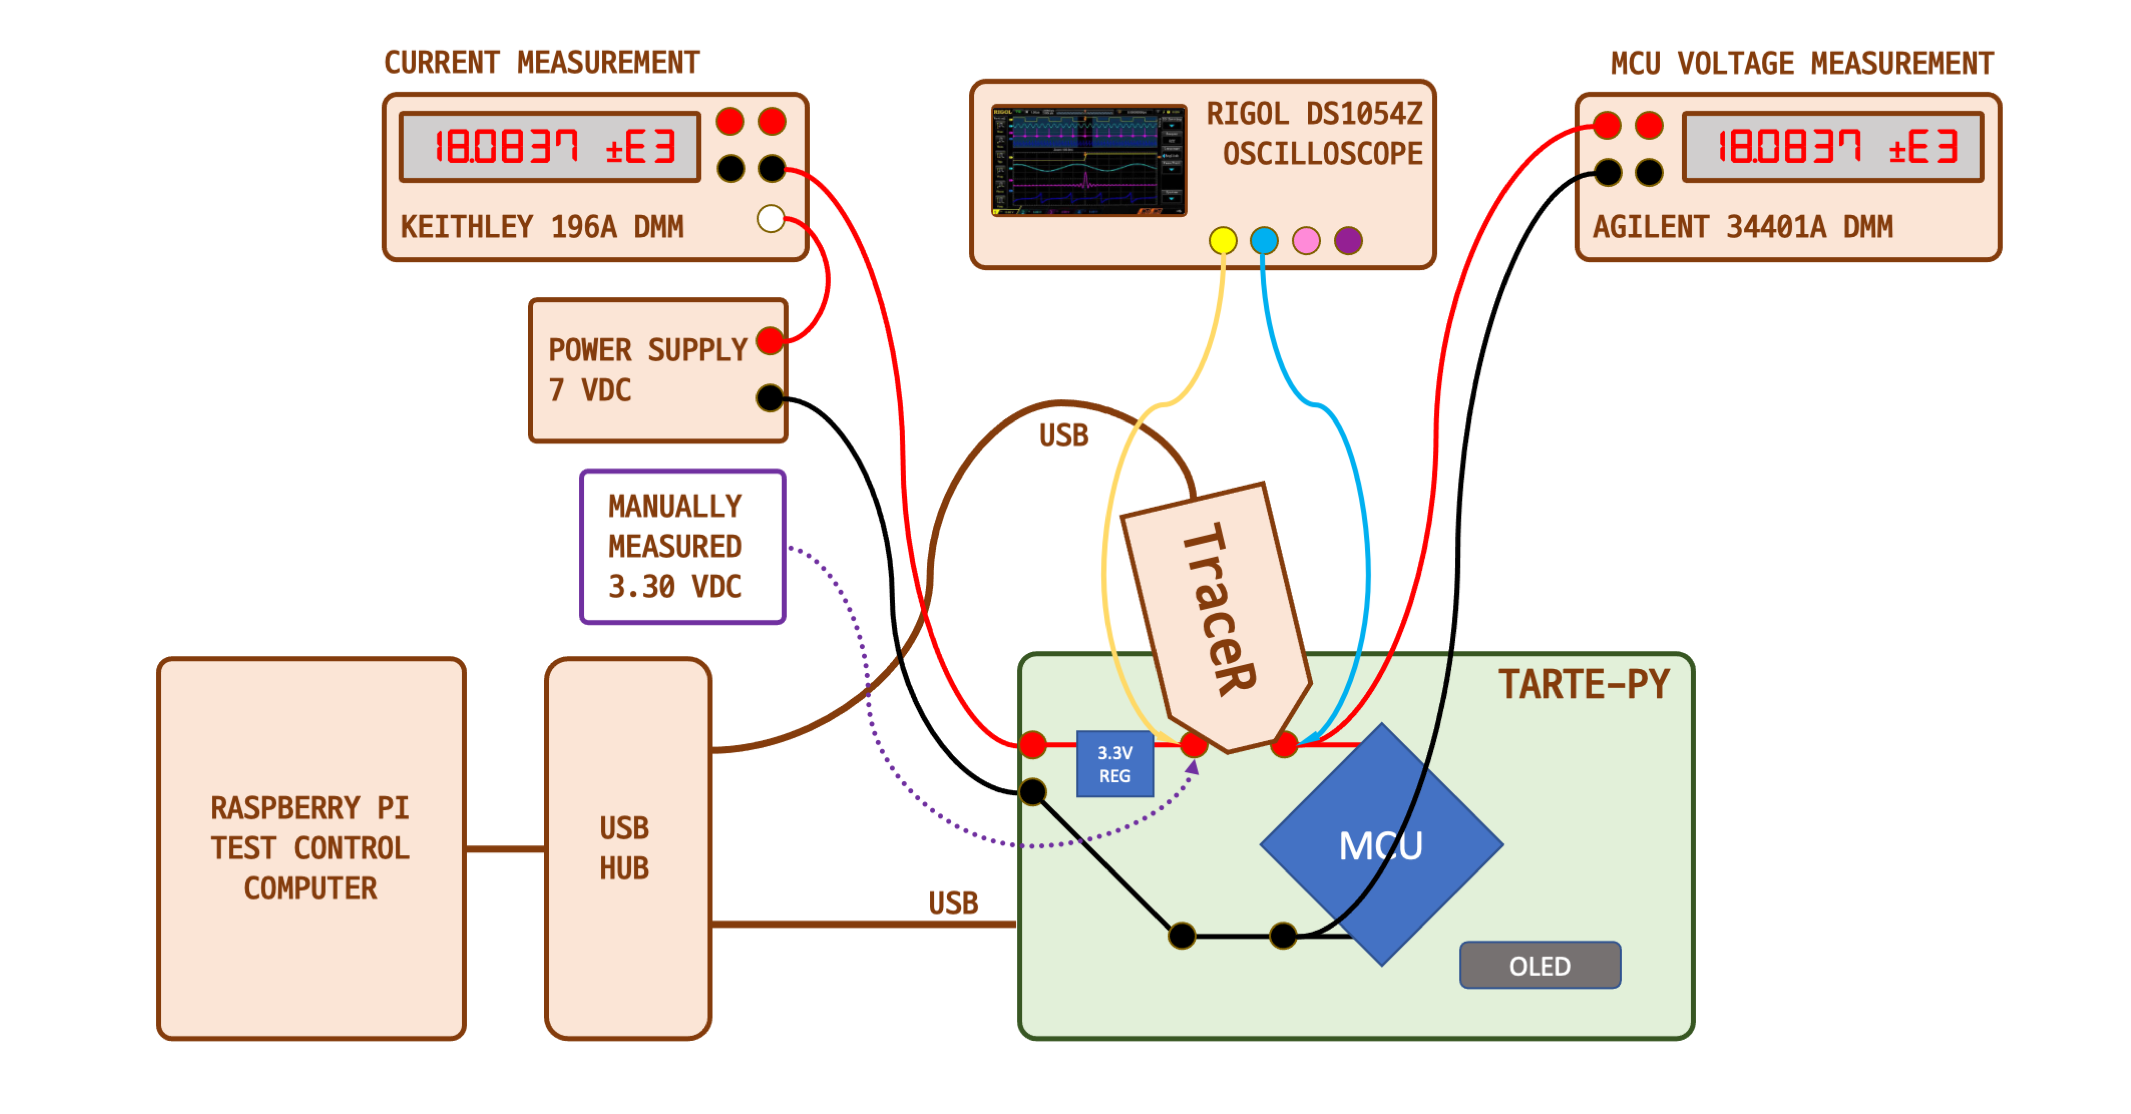
An abbreviated schematic of the test connections is shown above. I didn’t want power for this test to come from the test computer or USB hub, so the Tarte-Py is powered from an external power supply set to +7 VDC. Isolation diode D1 prevents the USB from providing any power supply current. Current is measured externally as it goes into the board. This isn’t perfect, but it was awkward to measure current right at the node where the TraceR module was mounted. Since the +3.3 VDC regulator is linear (not a switcher), with a little hand-waving we can say the input and output currents are roughly equivalent.
The Tarte-Py USB port is connected to the Raspberry Pi test computer. The test is started by opening a Micropython REPL shell and running the clock.py program. The TraceR module is installed as shown, and its USB port is also connected to the test computer. When using the TraceR modules in power circuits, you will recall we can use them in pairs, so that the two resistors in the module are in parallel. I could have also used a shell to type TraceR commands, but instead I added a very short test script in the tracer.py module. This script performs the resistance calculations, simple though they may be, and sets both resistances almost simultaneously. For example, if I type in 7.5 at the prompt, the script sends the R1=15 and R2=15 ohm commands back-to-back to the TraceR module. I can also operate both relays together using this script by just typing short or open at the prompt. (I will eventually move these paired commands onto the TraceR itself).
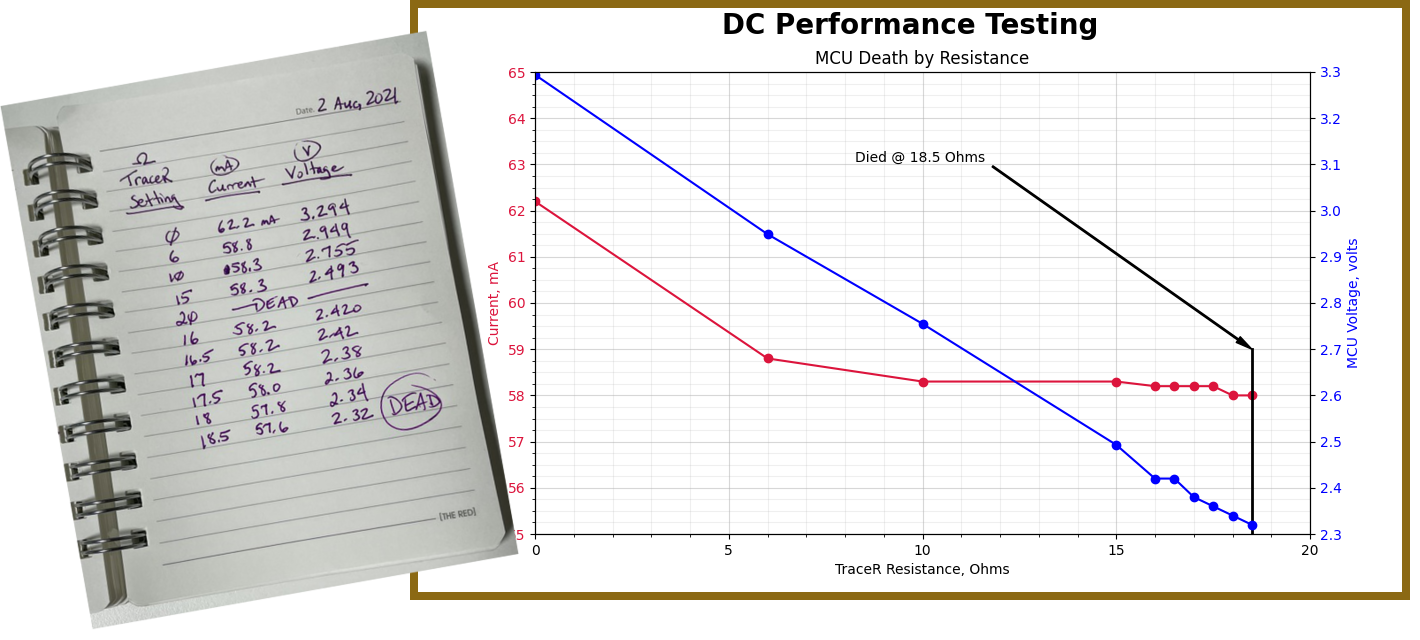
The beginning measurement of the test is with the clock program running on the Tarte-Py. The TraceR module is set at 6 ohms, about the lowest value it can go (both channels set to 12 ohms), and both TraceR relays are shorted. Regulator output before the TraceR module is confirmed to be 3.3V by a manual measurement, and the test begins by increasing the resistance slowly. The measured values of current and voltage are shown and plotted below.
What Does It Mean?
As I watched the MCU die a few times during my tests, I began wondering, why? Many microprocessors are designed to operate at voltages lower than the 2.6 V which killed the Tarte-Py’s STM32F405 MCU. For example, here is a random sampling of a few microprocessors and their operating voltage:
- ST Micro, STM32F405: 1.8 to 3.6 V
- Microchip, SAMD51J20A: 1.71 to 3.63 V
- Microchip, ATmega328: 1.8 to 5.5
- Nordic, nRF5340: 1.7 to 5.5 V
- Espressif, ESP32: 1.8 to 3.6 V
So what’s happening? I have two theories. Either or both may be at work. Specifically for the STM32F405 and similar MCUs, as the supply voltage decreases, your program must account for, and possible adjust, performance limitations regarding key components such as clocking arrangements, PLL settings, and Flash memory. Normally these machinations are done well in advance during the design process for one or two fixed design voltages. The case where the supply voltage changes dynamically and almost at random is not one frequently encountered.
Another issue which may be at play is the local power supply filtering. The filter capacitor values are from reference designs which were made with copper traces in mind. The “death” of the MCU at 2.6 V may in fact be due to a momentary surge in current which could not be supplied by the local filter caps.
Conclusions
In hindsight, this test was a little bit unfair to our MCU, as it emphasized the shortcomings of a design and layout made for copper PCBs. Not surprisingly, it is not entirely suitable for a conductive ink PCB. The problems I observed in these tests could be readily solved by putting the regulator close to the MCU, run your chip at as low a voltage as possible, and carefully size your filter capacitors for the environment.
On the topic of design tips, one key point when designing for conductive ink PCBs seems to be the management of voltage drops. There is a lot of interest in low-power devices these days, and hence a lot of resources (see the notes below) available. And while lowering the power consumption of our design might not be the primary goal, lower power means less current which translates to lower voltage drops.
Further Serial Link Investigation
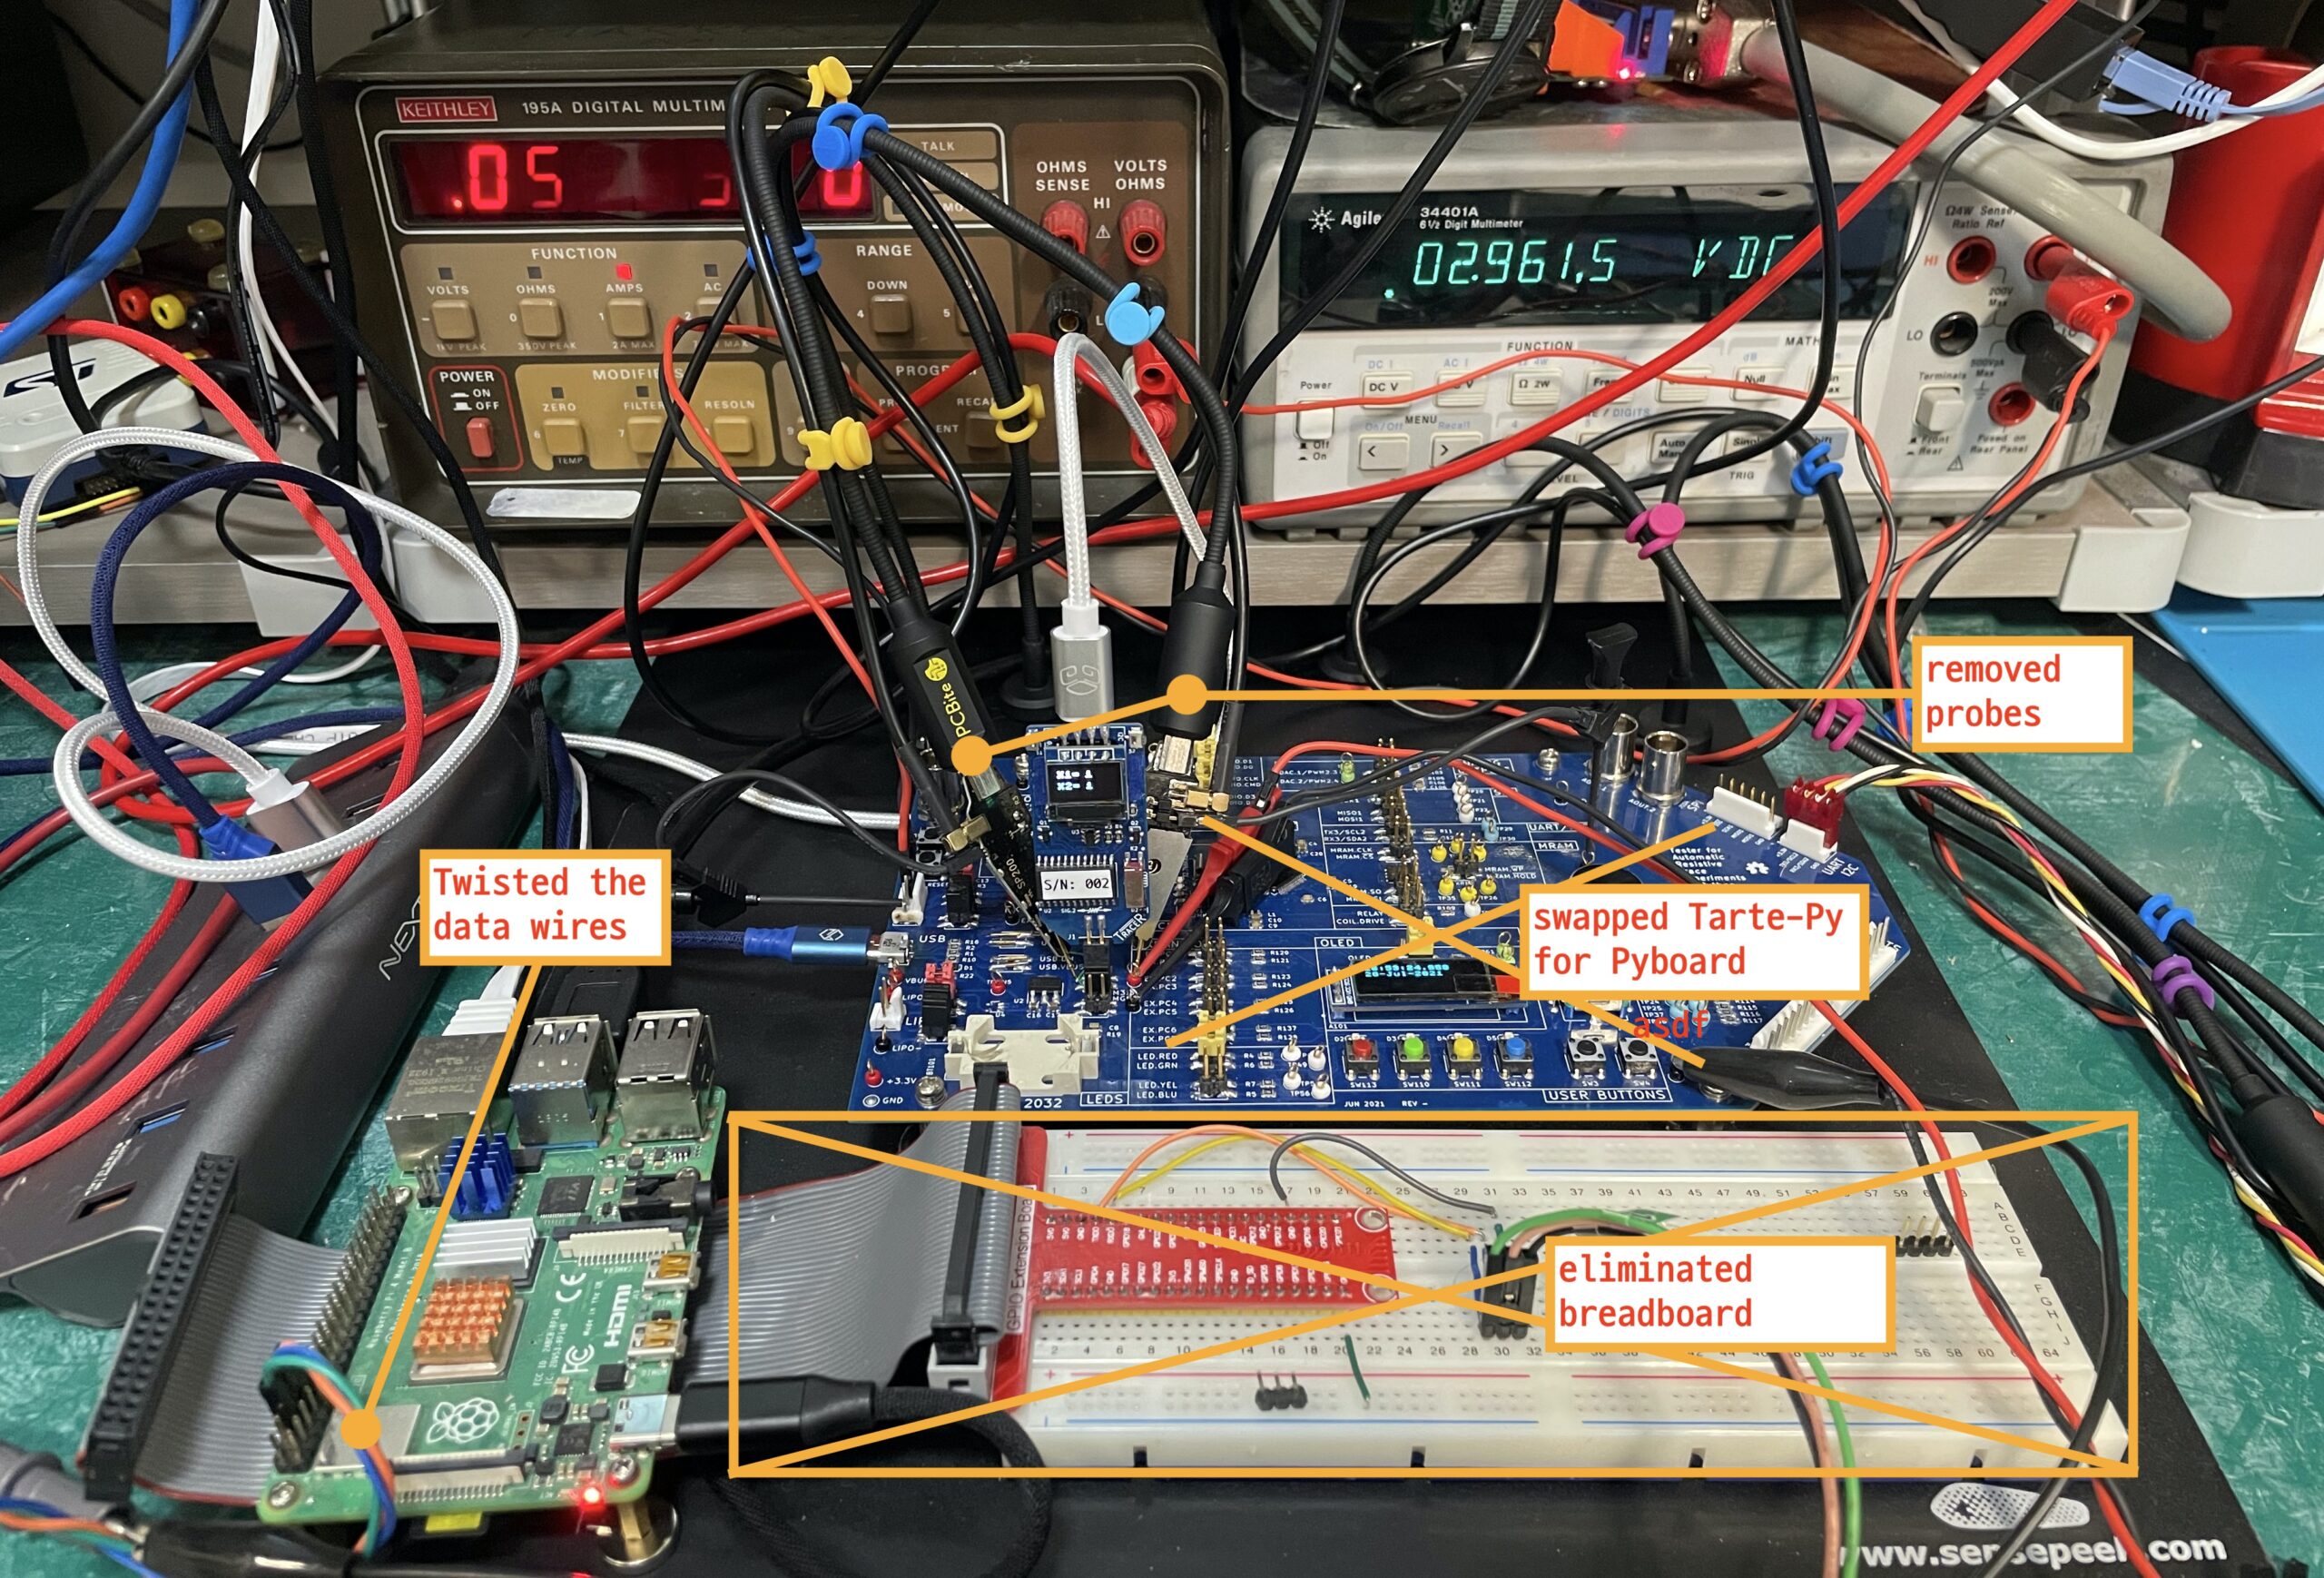
After the serial link error results from the past post, I tried a few more tests to eliminate candidate problems from the system, one-by-one. I used the Tarte-Py board with simple jumper shunts (no Tracer module installed) as the starting point. I then swapped out the Tarte-Py board entirely for a standard, off-the-shelf Pyboard. Next I removed the breadboard from the mix, connecting directly to the Raspberry Pi GPIO pins. The oscilloscope probes were removed next, and finally I twisted the wires forming the short link.
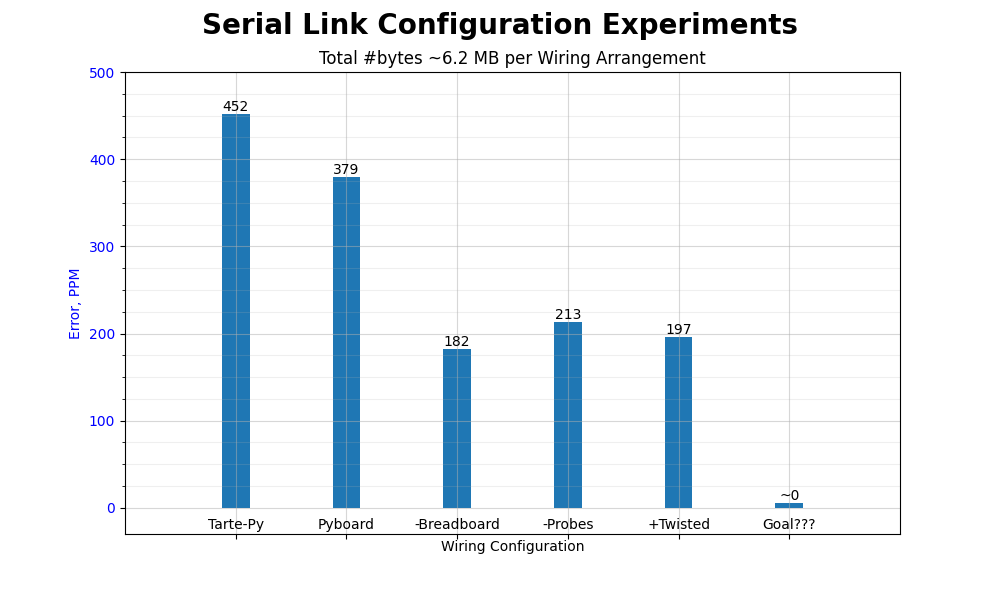
As you can see, there were some changes, but still nowhere neat the expected goal of zero ppm error. Just a little more testing remains, and I’ll hopefully report the successful resolution to this mystery next time.
What’s Next?
Next write up will focus more on high speed switching edge times, and wrap up any loose ends or topics that remaining. The following and final post will wrap up this series, going over the main points we’ve explored in these tests. And I look forward to introducing another series, on a yet-to-be-disclosed related topic soon. Feel free to ask my any questions in the comments below, or reach out directly to the staff at NovaCentrix.
Notes
- “Optimizing power and performance with STM32L4 and STM32L4+ Series microcontrollers”, Application Note AN476, ST Microelectronics, Jan 2021
- “Using STM32F4 MCU power modes with best dynamic efficiency”, Application Note An4365, ST Microelectronics, May 2014
- “Low-Power Design Guide”, Application Note AN1416, Microchip, Aug 2011